Performance
The Numbers. All of Them.
Backtested results from the TradingView Strategy Tester — including the drawdowns, the flat periods, and the parameters used to generate every figure on this page.
Key Metrics
Full-Cycle Results
All figures use the default configuration. Commission: 0.06% per trade. Slippage: 2 ticks. Starting capital: 500 USDT.
Number of all completed round-trip trades. Reflects the trading frequency and the selective nature of the strategy.
Percentage of completed trades that closed in profit. Without the corresponding profit/loss ratio, this value alone is not meaningful.
Gross profit divided by gross loss. Above 1.0 means more won than lost. Values above 1.5 are considered robust.
Total realized profit across all completed trades after deducting commissions and slippage.
Largest peak-to-trough decline in equity during the entire simulation — a measure of the maximum risk the capital was exposed to.
Average gain per winning trade and average loss per losing trade. The ratio reflects the efficiency of the strategy's risk/reward management.
The extreme values across all completed trades. Shows the range of possible individual outcomes and helps assess outliers.
Average profit or loss per trade. A positive value means every trade contributes to capital growth over the long run.
Methodology
How These Numbers Were Generated
The assumptions behind a backtest matter as much as the results. These are ours — stated plainly so you can evaluate them yourself.
Platform
All simulations were run inside the TradingView Strategy Tester using its native backtesting engine. Results are dependent on TradingView's data feed and execution simulation model.
Data
BTCUSDT perpetual contract data from Bitget, accessed via TradingView's data feed. The test window covers [start date] to [end date], spanning at least one full bull-bear-recovery cycle.
Commission
0.06% per trade applied in both directions — matching Bitget's publicly documented taker fee structure at the time of testing. If you trade on a different exchange or tier, your actual costs will differ.
Slippage
A slippage parameter of 2 ticks was applied within TradingView to simulate execution friction. Real slippage during high-volatility events may exceed this assumption.
Entry Logic
Entries are triggered intrabar when conditions are met, without waiting for bar close. Exits are confirmed at bar close. This approach matches the intended live execution behavior.
Intrabar Simulation
TradingView's engine models intrabar execution based on OHLC data, not tick data. This means take-profits triggered mid-bar may show slightly better fills than real execution — a known limitation of platform backtesting.
No Repainting
The strategy uses only confirmed, closed-bar data for signal generation. No indicators that repaint on recalculation are used. Signals shown on historical bars are the signals that would have appeared in real time.
Configuration
What the Settings Actually Do
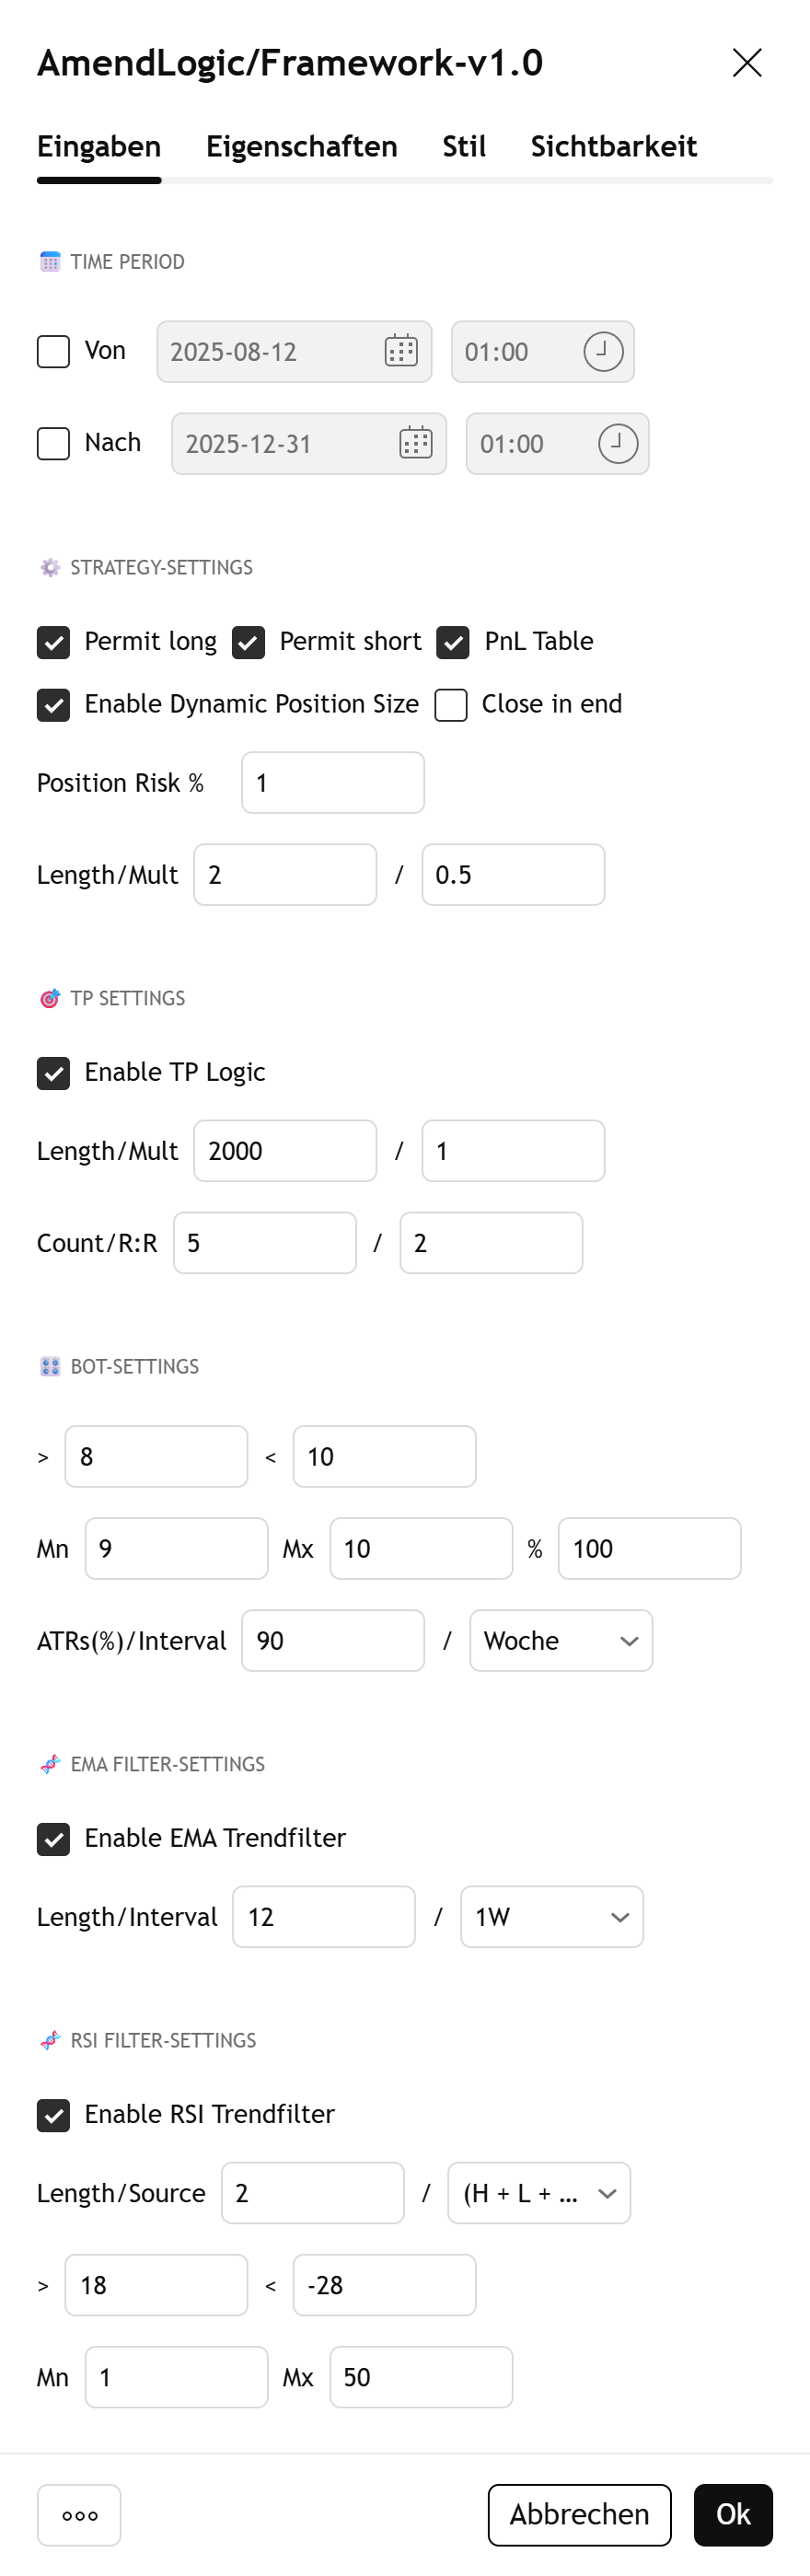
These are the parameters you can adjust in the TradingView strategy panel — and what changes when you move them.
Time Period
Defines the active time window during which the strategy analyzes signals and executes trades. Restricting trading to specific hours allows you to deliberately exclude unfavorable market conditions — such as low liquidity periods or scheduled news events.
Strategy Settings
Controls the trading direction (Long, Short, or both) as well as automatic position sizing based on a configurable risk factor. The risk factor directly scales the capital allocated per trade — higher values increase both returns and drawdown proportionally.
Take Profit
Configures up to five staggered take-profit targets, each closing a defined portion of the position when a specific price level is reached. Scaling out of trades incrementally reduces the risk of giving back unrealized gains and improves the overall risk-reward profile across a larger sample of trades.
Bot Settings
Fine-tuning of the strategy for specific timeframes and cryptocurrencies. These parameters allow you to precisely adapt the strategy's behavior to the market structure and volatility of a given asset — without altering the core logic.
EMA Filter Settings
Incoming signals are filtered through a single exponential moving average (EMA). Trades that run counter to the prevailing trend are suppressed — reducing market noise and improving the quality of executed entries.
RSI Trend Filter
The RSI is used as a secondary filter to identify overbought and oversold conditions, suppressing signals during unfavorable market phases. The result is more selective entries with fewer false signals in choppy or exhausted markets.
Performance Table
Displays the strategy's monthly PnL directly on the chart. The table provides a quick overview of winning and losing months, seasonal patterns, and the consistency of the strategy across different market conditions.
Alternative Configurations
How Results Change Across Risk Settings
The same core strategy logic applied at different risk configurations produces meaningfully different equity curves. Lower risk settings reduce both drawdown and absolute return. These charts show the trade-off explicitly.